Sourcegraph monitoring guide
This page documents Sourcegraph-specific guides on developing monitoring for Sourcegraph. For general observability development, refer to the observability developer documentation.
For more context on monitoring at Sourcegraph, you should refer to:

Finding monitoring
This section outlines how to leverage existing Sourcegraph monitoring for scenarios specific to engineers at Sourcegraph.
For general documentation on finding monitoring, refer to how to find monitoring.
For documentation on how site administrators find monitoring, refer to the Sourcegraph observability documentation.
Metrics
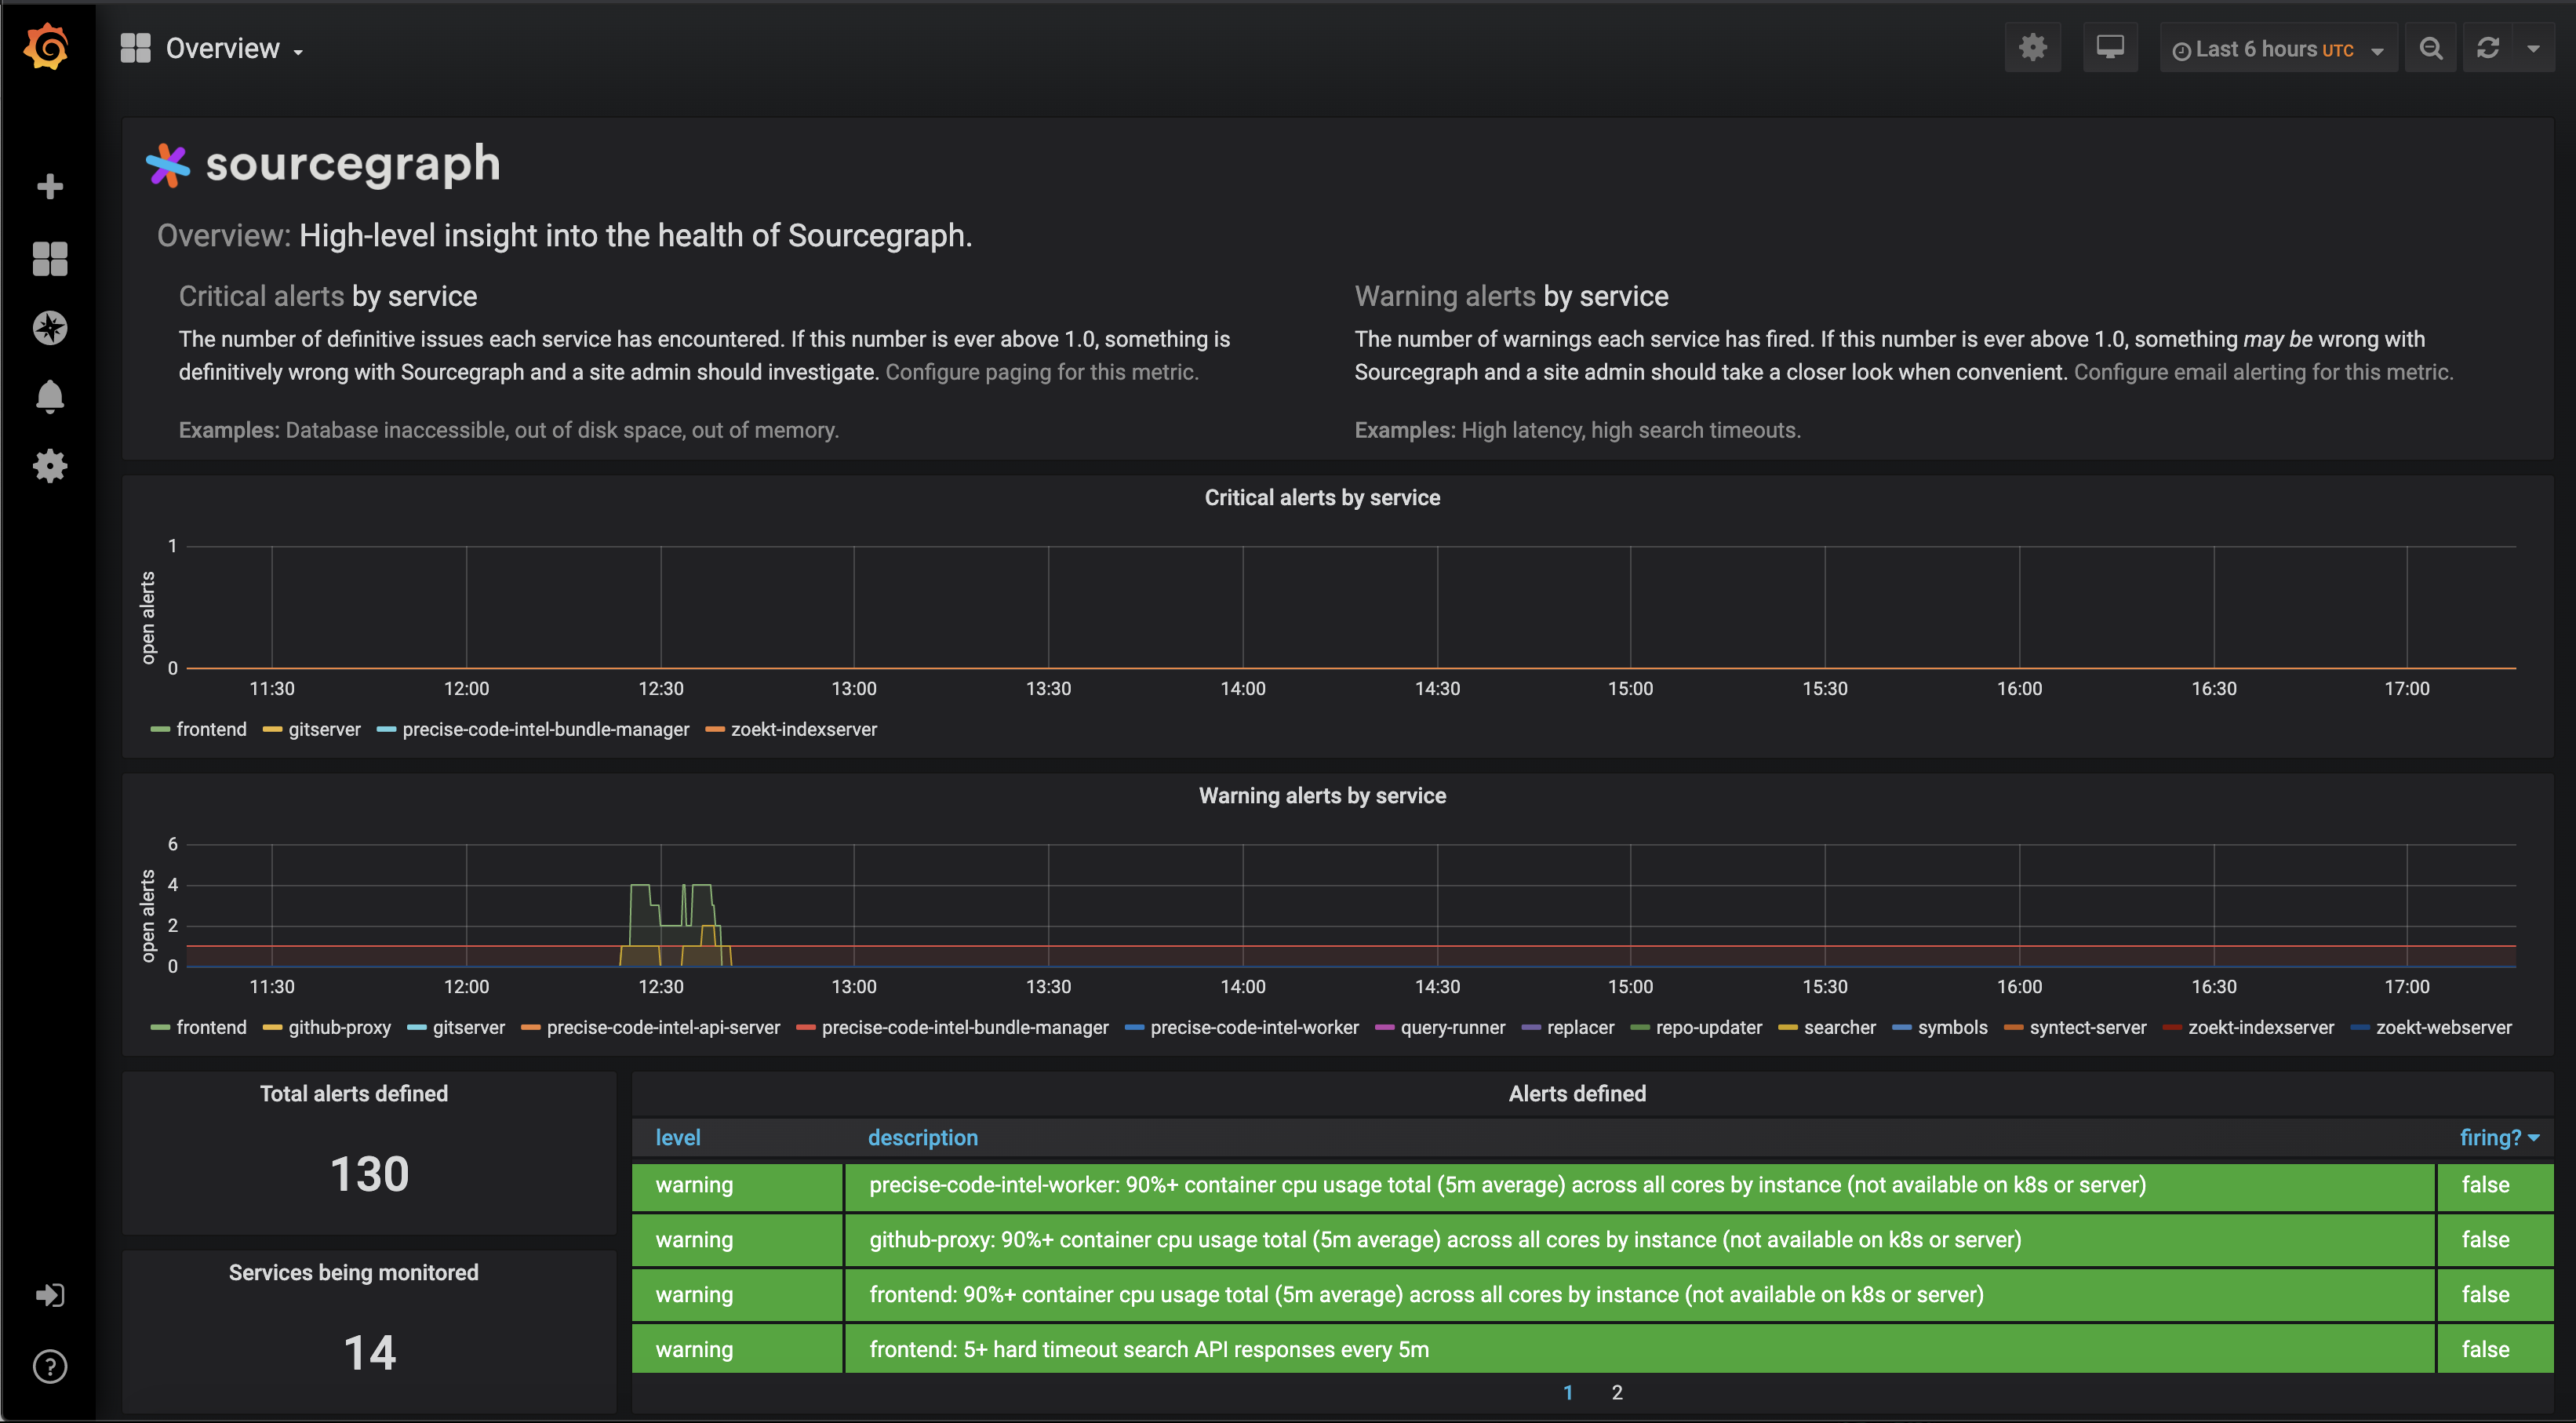
To view metrics, built-in Grafana dashboards are available in https://sourcegraph.com/-/debug/grafana. Learn about these dashboards in the customer-facing Grafana documentation, and more about how metrics and alerting work in monitoring architecture
Custom dashboards are also available via the Grafana interface’s dashboards browser.
Alerts
This section describes where Sourcegraph employees can find active alerts for Sourcegraph instances. Learn about these alerting in the customer-facing alerting documentation, and more about how metrics and alerting work in monitoring architecture
Sourcegraph instances
Instances managed by Sourcegraph (Sourcegraph Cloud, k8s.sgdev.org, etc.) have alerts redirected to Slack and Opsgenie as documented in the instances page.
Additional details can be found in each instance’s Grafana dashboards (/-/debug/grafana).
If you wish, you can set up Slack alerts for your own team on various instances by adding something like the following to the site configuration (site-admin/configuration) of that instance:
  "observability.alerts": [
    {
      "level": "critical",
      "notifier": {
        "type": "slack",
        "username": "$TEAM - Sourcegraph Cloud",
        "url": "https://hooks.slack.com/services/..."
      },
      "owners": [
        "$TEAM"
      ]
    },
  ]
To silence an alert on a Sourcegraph instance you need to edit the deployed ConfigMap. For example, for Sourcegraph Cloud you need to edit this file and push to the release branch.
Customer instances
The bug report page (/site-admin/report-bug) for each Sourcegraph instance has a page that provides useful information about an instance’s configuration. In this page, there is a field "alerts": that can be used to request recent alert data from customer instances:
  "alerts": [
    {
      "serviceName": "executor-queue",
      "name": "warning: executor_queue_growth_rate",
      "timestamp": "2020-11-28T14:00:00Z",
      "average": 0.6504517025712306, // % of last 12 hours during which this alert was firing
      "owner": "code-intel"
    },
    // ...
  ]
Data for recent alerts and metrics can be requested from customers from their Grafana dashboards (/-/debug/grafana).
Adding monitoring
See the how to add monitoring guide for most use cases. This section describes guides specific to engineers at Sourcegraph.
Creating Cloud-only Grafana dashboards
While all dashboards required to troubleshoot our product should be shipped to customers, our Cloud deployment might require additional dashboards to the ones we ship to customers, for example:
- When the additional dashboard is not ready yet to graduate to customers
- When the additional dashboard applies only to our Cloud deployment
Dashboards can be deployed to our Cloud deployment by adding them in json format to dashboards/files in deploy-sourcegraph-cloud.
To learn more, reference the dashboard generator documentation.
Once the dashboard is ready to be shipped to customers, we will need to port it to the monitoring generator to be included in our next Sourcegraph release.
Custom dashboards cannot be added to the sourcegraph/grafana except through the generator.
You can use a local Grafana or the Cloud Grafana to create a new dashboard and once its ready, export it by following these steps:
- Open “Dashboard Settings” (top right cog).
- Select “JSON Model”.
- Select the JSON content and save to a
.jsonfile insourcegraph/deploy-sourcegraph-cloud/dashboards/files. - Create a new Pull Request with your changes.
Once deployed, you should be able to see your changes in sourcegraph.com.
Warning: Sourcegraph’s Grafana UI does not allow direct changes due to a CSRF issue (#6075).
Additional reading
- Observability development guide
- Sourcegraph’s high-level alerting metrics
- The difference between Warning and Critical alerts
- How some organizations query our high-level alerts for integration with their own systems and the related FAQ item, “Can I consume Sourcegraph’s metrics in my own monitoring system?”
- Admin documentation for observability
Next steps
- Look at the monitoring for one of our services: monitoring/symbols.go
- Check out the API documentation for
Observable - Send a PR and tag
@slimsagor@distributionfor review!